 |
| The Market Mood |
Always remember that we can only control ourselves.
This is the second part of my post on the Four Best Moving Averages. Previously, I have already explained the first two of the moving averages which are the EMAs: 8 and 21. They provide a good view about the immediate market trend and levels of the nearest supports and resistances.
The EMAs itself is enough to show you the trend of the market. However, to understand the market better you need to equipped yourself with these two SMAs (Simple Moving Averages).
SMA 89 and SMA 200 - The Market Mood Reader
 |
| Simple Moving Averages in Action |
Remind yourself, the market consists of you, me, other traders and yes.. the brokers. So it is fundamentally important to understand how the human minds works.
How do you react upon losing extravagant amount of money?
What will you do when you cash out the 1000+ pips profit?
What do you feel?
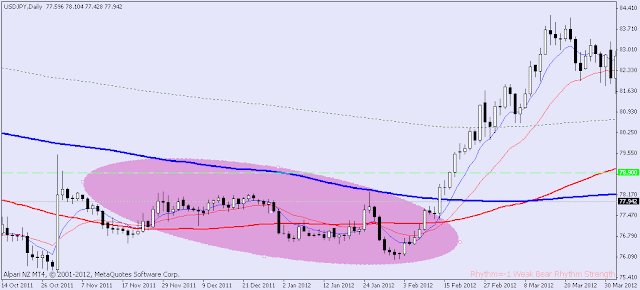
The SMA 89 made it simple for you to be a market mind reader. It is as simple as this: When the price is below the SMA 89 then the market mood is bearish. When the price is above the SMA 89 then the market mood is bullish.
Again, not just because the price are below or above the SMA89 then you go long or short.
The SMA 200 is the territory separator between the bullish and the bearish. It shows the fundamental trend of the market. It is most useful when you are setting the target for longer term trading.
What Happens When They Met?
The SMAs are represented by the thick red and blue line above. Notice that if they narrow together and the price is moving between them, then we can say that the market will be oscillating between the SMAs. It is most advised that we stay out of the market when this happens.
Did I say that the moving averages may provide the support and resistance? While it is like so, I recommend you to read again and again about the support and resistance.
If you would like to read more about this four moving averages, you may go to the Forex Factory and search for the 4Hour MACD strategy thread by Philip Nel. There you will find a vast amount of how to use the moving averages in a complete manner.
Until then,
Enjoy your weekend.


